State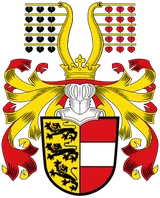
Carinthia: municipalities in numbers
Carinthia (state) has 132 municipalities and 569,990 residents across 9,543 km², or 60 people per km². Population: +1.7% between 2016 and 2026.
- 569,990 residents
- 132 municipalities
- 9,543 km²
- 60 people/km²

Map and records: Carinthia
All municipalities in Carinthia
Click a column heading to sort the table.
| Municipality | Population | Population change over 10 years | Population density | Area | Share of people under 15 | Share of people aged 65 and over |
|---|---|---|---|---|---|---|
| Klagenfurt am Wörthersee | 105,734 | +6.7% | 880.5 people/km² | 120.1 km² | 12.5% | 22.5% |
| Villach | 66,051 | +7.9% | 489.3 people/km² | 135.0 km² | 12.6% | 22.9% |
| Wolfsberg | 25,011 | −0.2% | 89.7 people/km² | 278.8 km² | 13.1% | 25.1% |
| Spittal an der Drau | 15,263 | −1.6% | 314.1 people/km² | 48.6 km² | 11.9% | 26.5% |
| Feldkirchen in Kärnten | 14,558 | +2.2% | 187.7 people/km² | 77.6 km² | 13.5% | 24.3% |
| St. Veit an der Glan | 12,178 | −2.8% | 239.7 people/km² | 50.8 km² | 10.9% | 25.5% |
| Völkermarkt | 10,803 | −1.3% | 78.6 people/km² | 137.5 km² | 12.4% | 24.6% |
| St. Andrä | 9,836 | −2.3% | 86.6 people/km² | 113.6 km² | 12.7% | 25.5% |
| Finkenstein am Faaker See | 9,591 | +9.0% | 93.9 people/km² | 102.1 km² | 14.3% | 22.1% |
| Velden am Wörther See | 9,171 | +2.4% | 173.0 people/km² | 53.0 km² | 11.2% | 28.2% |
| Ebenthal in Kärnten | 8,163 | +5.0% | 148.4 people/km² | 55.0 km² | 13.7% | 23.1% |
| Ferlach | 7,537 | +5.9% | 64.2 people/km² | 117.4 km² | 12.8% | 26.3% |
| Arnoldstein | 7,171 | +2.0% | 106.3 people/km² | 67.5 km² | 13.5% | 23.2% |
| Hermagor-Pressegger See | 6,930 | +1.3% | 33.7 people/km² | 205.4 km² | 12.8% | 27.6% |
| Seeboden am Millstätter See | 6,681 | +6.0% | 150.3 people/km² | 44.5 km² | 12.3% | 28.4% |
| Eberndorf | 5,983 | +2.0% | 88.2 people/km² | 67.8 km² | 13.9% | 25.4% |
| Paternion | 5,762 | −1.9% | 54.6 people/km² | 105.5 km² | 12.5% | 26.3% |
| Radenthein | 5,686 | −4.0% | 63.6 people/km² | 89.3 km² | 10.9% | 28.4% |
| Wernberg | 5,641 | +1.0% | 213.4 people/km² | 26.4 km² | 13.7% | 23.2% |
| Althofen | 4,976 | +4.3% | 405.2 people/km² | 12.3 km² | 13.7% | 22.8% |
| Friesach | 4,830 | −3.6% | 39.9 people/km² | 120.9 km² | 12.2% | 29.2% |
| St. Kanzian am Klopeiner See | 4,654 | +3.8% | 113.2 people/km² | 41.1 km² | 13.4% | 24.6% |
| Moosburg | 4,649 | +2.6% | 126.4 people/km² | 36.8 km² | 15.0% | 26.3% |
| Treffen am Ossiacher See | 4,493 | +3.1% | 63.2 people/km² | 71.1 km² | 10.4% | 30.2% |
| St. Jakob im Rosental | 4,325 | +1.8% | 55.0 people/km² | 78.7 km² | 12.3% | 26.2% |
| Bad St. Leonhard im Lavanttal | 4,202 | −4.8% | 37.6 people/km² | 111.9 km² | 13.4% | 25.7% |
| Maria Saal | 4,040 | +5.5% | 115.9 people/km² | 34.9 km² | 13.9% | 26.5% |
| Bleiburg | 4,015 | −0.5% | 57.5 people/km² | 69.8 km² | 13.3% | 22.8% |
| Steindorf am Ossiacher See | 3,844 | +2.2% | 130.0 people/km² | 29.6 km² | 11.9% | 27.6% |
| Magdalensberg | 3,727 | +12.2% | 86.9 people/km² | 42.9 km² | 15.2% | 23.1% |
| Krumpendorf am Wörthersee | 3,608 | +2.8% | 304.2 people/km² | 11.9 km² | 11.8% | 26.5% |
| St. Georgen am Längsee | 3,599 | −2.4% | 51.5 people/km² | 69.9 km² | 14.8% | 22.6% |
| Frauenstein | 3,544 | −2.8% | 38.0 people/km² | 93.3 km² | 14.2% | 24.6% |
| Millstatt am See | 3,458 | +1.9% | 59.8 people/km² | 57.8 km² | 11.1% | 29.6% |
| Liebenfels | 3,401 | +3.5% | 57.7 people/km² | 58.9 km² | 14.9% | 22.1% |
| Griffen | 3,392 | −3.6% | 45.3 people/km² | 74.9 km² | 13.2% | 22.9% |
| Poggersdorf | 3,384 | +7.7% | 110.0 people/km² | 30.8 km² | 15.3% | 20.5% |
| Kötschach-Mauthen | 3,316 | −4.2% | 21.4 people/km² | 154.6 km² | 12.3% | 29.0% |
| Köttmannsdorf | 3,190 | +9.7% | 113.1 people/km² | 28.2 km² | 14.6% | 24.3% |
| St. Paul im Lavanttal | 3,176 | −5.7% | 66.9 people/km² | 47.5 km² | 13.2% | 26.9% |
| Grafenstein | 3,064 | +6.2% | 61.0 people/km² | 50.2 km² | 15.9% | 21.1% |
| Pörtschach am Wörther See | 2,959 | +9.0% | 233.9 people/km² | 12.7 km² | 12.0% | 29.5% |
| Weißenstein | 2,885 | −3.3% | 58.7 people/km² | 49.2 km² | 12.8% | 26.9% |
| Maria Rain | 2,748 | +9.9% | 107.6 people/km² | 25.5 km² | 16.2% | 21.0% |
| Lavamünd | 2,735 | −8.3% | 29.2 people/km² | 93.7 km² | 11.8% | 26.9% |
| Schiefling am Wörthersee | 2,726 | +4.3% | 95.2 people/km² | 28.6 km² | 12.8% | 23.6% |
| Brückl | 2,677 | −3.4% | 57.3 people/km² | 46.7 km² | 13.5% | 24.6% |
| Lurnfeld | 2,672 | +3.8% | 80.9 people/km² | 33.0 km² | 13.4% | 26.0% |
| Gmünd in Kärnten | 2,545 | −2.2% | 80.6 people/km² | 31.6 km² | 12.6% | 26.8% |
| Feistritz im Rosental | 2,491 | +0.3% | 34.7 people/km² | 71.9 km² | 13.6% | 27.3% |
| Kirchbach | 2,455 | −7.8% | 24.8 people/km² | 99.1 km² | 13.0% | 28.1% |
| Keutschach am See | 2,444 | +0.2% | 86.1 people/km² | 28.4 km² | 11.1% | 27.8% |
| Frantschach-St. Gertraud | 2,418 | −9.1% | 23.9 people/km² | 101.0 km² | 13.1% | 26.9% |
| Nötsch im Gailtal | 2,358 | +6.0% | 55.2 people/km² | 42.7 km² | 14.1% | 26.6% |
| Himmelberg | 2,306 | +0.4% | 40.5 people/km² | 56.9 km² | 14.8% | 25.0% |
| Feistritz ob Bleiburg | 2,244 | +4.8% | 41.4 people/km² | 54.1 km² | 15.0% | 21.0% |
| Eisenkappel-Vellach | 2,211 | −8.0% | 11.1 people/km² | 199.5 km² | 11.4% | 29.1% |
| Techelsberg am Wörther See | 2,195 | +0.2% | 77.3 people/km² | 28.4 km² | 11.3% | 24.6% |
| Obervellach | 2,168 | −5.1% | 20.8 people/km² | 104.5 km² | 13.8% | 26.0% |
| Bad Bleiberg | 2,109 | −9.6% | 47.1 people/km² | 44.8 km² | 11.4% | 30.1% |
| Reißeck | 2,085 | −5.2% | 14.9 people/km² | 139.8 km² | 12.2% | 28.9% |
| Ferndorf | 2,020 | −7.6% | 64.3 people/km² | 31.4 km² | 11.3% | 27.7% |
| Weitensfeld im Gurktal | 1,987 | −7.8% | 20.7 people/km² | 95.8 km² | 13.1% | 27.5% |
| Straßburg | 1,966 | −7.9% | 20.2 people/km² | 97.5 km² | 14.1% | 28.1% |
| Steinfeld | 1,958 | −4.7% | 24.1 people/km² | 81.4 km² | 13.0% | 27.6% |
| Irschen | 1,925 | −3.7% | 57.5 people/km² | 33.5 km² | 13.1% | 23.4% |
| Rosegg | 1,925 | +6.8% | 100.5 people/km² | 19.2 km² | 13.0% | 22.4% |
| Sittersdorf | 1,925 | −7.0% | 42.7 people/km² | 45.0 km² | 10.6% | 27.2% |
| Kappel am Krappfeld | 1,923 | −4.2% | 38.7 people/km² | 49.7 km² | 13.1% | 23.0% |
| St. Georgen im Lavanttal | 1,892 | −4.2% | 26.1 people/km² | 72.4 km² | 14.3% | 21.5% |
| Malta | 1,858 | −8.2% | 7.1 people/km² | 262.2 km² | 12.5% | 24.5% |
| Baldramsdorf | 1,827 | 0.0% | 48.1 people/km² | 38.0 km² | 13.2% | 23.5% |
| Gallizien | 1,808 | +1.9% | 38.8 people/km² | 46.6 km² | 12.0% | 24.3% |
| Metnitz | 1,804 | −11.7% | 8.1 people/km² | 223.4 km² | 12.5% | 29.0% |
| Lendorf | 1,804 | +4.2% | 52.5 people/km² | 34.4 km² | 14.6% | 21.2% |
| Glanegg | 1,802 | −6.3% | 71.5 people/km² | 25.2 km² | 12.9% | 25.4% |
| Ludmannsdorf | 1,801 | −0.2% | 68.3 people/km² | 26.4 km² | 13.8% | 24.5% |
| Klein St. Paul | 1,754 | −6.3% | 25.6 people/km² | 68.6 km² | 13.7% | 25.6% |
| Reichenfels | 1,708 | −9.8% | 19.6 people/km² | 87.3 km² | 12.7% | 25.8% |
| Reichenau | 1,694 | −7.6% | 14.9 people/km² | 114.1 km² | 11.1% | 28.3% |
| Rangersdorf | 1,692 | −2.6% | 20.1 people/km² | 84.3 km² | 15.1% | 21.9% |
| Greifenburg | 1,689 | −3.8% | 22.2 people/km² | 76.2 km² | 14.3% | 25.9% |
| Rennweg am Katschberg | 1,640 | −6.7% | 13.6 people/km² | 120.5 km² | 14.1% | 23.8% |
| Maria Wörth | 1,636 | +5.9% | 94.0 people/km² | 17.4 km² | 11.0% | 29.7% |
| St. Urban | 1,628 | +4.6% | 59.7 people/km² | 27.2 km² | 14.7% | 23.3% |
| Bad Kleinkirchheim | 1,623 | −4.0% | 21.9 people/km² | 74.0 km² | 9.0% | 29.9% |
| Dellach im Drautal | 1,604 | −1.3% | 21.1 people/km² | 76.1 km² | 15.5% | 25.5% |
| Krems in Kärnten | 1,581 | −7.9% | 7.6 people/km² | 207.6 km² | 11.5% | 26.5% |
| Steuerberg | 1,573 | −9.2% | 48.0 people/km² | 32.8 km² | 12.4% | 24.0% |
| Stockenboi | 1,550 | −4.2% | 15.5 people/km² | 100.1 km² | 15.0% | 24.4% |
| Globasnitz | 1,550 | −2.7% | 40.4 people/km² | 38.4 km² | 12.2% | 23.5% |
| St. Stefan im Gailtal | 1,530 | −3.7% | 23.1 people/km² | 66.2 km² | 12.0% | 34.4% |
| Guttaring | 1,520 | +5.4% | 27.7 people/km² | 55.0 km² | 14.7% | 23.8% |
| Stall | 1,483 | −7.7% | 15.4 people/km² | 96.5 km² | 13.5% | 22.9% |
| Afritz am See | 1,480 | +3.3% | 52.7 people/km² | 28.1 km² | 12.9% | 26.5% |
| Ruden | 1,468 | −4.2% | 34.6 people/km² | 42.4 km² | 12.2% | 23.4% |
| Mölbling | 1,337 | +1.8% | 27.3 people/km² | 49.0 km² | 15.9% | 22.1% |
| Großkirchheim | 1,316 | −4.2% | 12.0 people/km² | 109.6 km² | 15.1% | 24.9% |
| Arriach | 1,315 | −2.7% | 18.6 people/km² | 70.8 km² | 14.7% | 27.8% |
| Sachsenburg | 1,310 | +1.0% | 30.7 people/km² | 42.6 km² | 15.0% | 21.0% |
| Lesachtal | 1,264 | −7.3% | 6.6 people/km² | 190.9 km² | 14.4% | 24.4% |
| Hüttenberg | 1,244 | −14.8% | 9.2 people/km² | 134.6 km² | 9.8% | 31.5% |
| Eberstein | 1,233 | −6.5% | 18.9 people/km² | 65.2 km² | 12.5% | 28.3% |
| Fresach | 1,233 | −1.4% | 31.8 people/km² | 38.8 km² | 15.7% | 26.7% |
| Gitschtal | 1,230 | −4.7% | 21.8 people/km² | 56.5 km² | 13.4% | 28.9% |
| Berg im Drautal | 1,227 | −6.7% | 22.6 people/km² | 54.3 km² | 13.9% | 25.6% |
| Dellach | 1,185 | −4.0% | 32.5 people/km² | 36.5 km² | 11.3% | 29.1% |
| Winklern | 1,179 | −2.7% | 31.7 people/km² | 37.2 km² | 10.9% | 26.8% |
| Oberdrauburg | 1,168 | −4.0% | 16.7 people/km² | 70.0 km² | 14.0% | 25.3% |
| Gurk | 1,152 | −9.5% | 29.0 people/km² | 39.7 km² | 12.8% | 27.9% |
| Kleblach-Lind | 1,143 | −3.1% | 18.1 people/km² | 63.0 km² | 15.4% | 23.5% |
| Trebesing | 1,137 | −4.1% | 15.4 people/km² | 73.8 km² | 14.2% | 23.1% |
| Flattach | 1,099 | −7.2% | 11.1 people/km² | 98.9 km² | 12.8% | 20.6% |
| St. Margareten im Rosental | 1,082 | +1.3% | 24.6 people/km² | 44.0 km² | 16.2% | 24.1% |
| Feld am See | 1,050 | −6.6% | 31.2 people/km² | 33.7 km² | 14.2% | 27.0% |
| Mühldorf | 1,028 | +2.3% | 42.1 people/km² | 24.4 km² | 13.2% | 26.1% |
| Gnesau | 1,019 | −3.0% | 13.0 people/km² | 78.6 km² | 15.2% | 23.6% |
| Neuhaus | 1,008 | −1.6% | 27.7 people/km² | 36.4 km² | 11.3% | 31.3% |
| Micheldorf | 974 | −4.9% | 57.2 people/km² | 17.0 km² | 13.2% | 26.2% |
| Heiligenblut am Großglockner | 947 | −7.2% | 4.9 people/km² | 193.3 km² | 13.2% | 27.5% |
| Albeck | 940 | −8.5% | 9.4 people/km² | 99.5 km² | 12.2% | 28.6% |
| Preitenegg | 883 | −7.6% | 12.9 people/km² | 68.4 km² | 13.4% | 26.7% |
| Hohenthurn | 880 | +3.9% | 32.3 people/km² | 27.2 km² | 12.0% | 24.1% |
| Glödnitz | 830 | +1.8% | 11.1 people/km² | 74.7 km² | 11.9% | 27.9% |
| Deutsch-Griffen | 820 | −11.6% | 11.5 people/km² | 71.6 km² | 12.1% | 29.1% |
| Mörtschach | 812 | +0.6% | 10.9 people/km² | 74.8 km² | 19.0% | 19.1% |
| Diex | 784 | −6.3% | 14.3 people/km² | 54.8 km² | 14.5% | 22.4% |
| Weißensee | 758 | +1.2% | 9.7 people/km² | 78.1 km² | 11.9% | 27.7% |
| Mallnitz | 753 | −7.8% | 6.7 people/km² | 111.8 km² | 10.4% | 35.7% |
| Ossiach | 718 | −23.6% | 41.3 people/km² | 17.4 km² | 10.3% | 28.4% |
| Feistritz an der Gail | 649 | +5.5% | 33.6 people/km² | 19.3 km² | 15.3% | 21.3% |
| Zell | 587 | −2.2% | 7.8 people/km² | 75.6 km² | 13.5% | 28.8% |
Carinthia compared with the national figures
Population-weighted averages for rates; totals for counts.
| Indicator | Carinthia | Austria |
|---|---|---|
| Share of people under 15 | 12.9% | 14.2% |
| Share of people aged 65 and over | 24.7% | 20.7% |
| Share of women | 51.1% | 50.7% |
| Share of foreign nationals | 13.6% | 20.1% |
| Private households | 262,459 | 4,139,571 |
| Families | 157,971 | 2,490,615 |
| Share of people aged 15 and over with an apprenticeship, BMS, AHS or BHS as highest qualification | 64.7% | 58.6% |
| Share of people aged 15 and over with a university, academy or college qualification as highest qualification | 15.0% | 17.6% |
| Employment rate (aged 15 to 64) | 73.3% | 73.6% |
| Unemployment rate (aged 15 and over) | 5.8% | 6.5% |
| Share of out-commuters among employed persons by place of residence | 55.8% | 53.0% |
| Persons employed in establishments in the municipality | 275,417 | 4,878,849 |
| Jobs per 100 inhabitants | 48.4 | 53.2 |
| Enterprises | 48,327 | 743,940 |
| Establishments | 56,049 | 850,266 |
| Establishments per 1,000 inhabitants | 98.3 | 92.6 |
| Active trade licences | 60,573 | 945,381 |
| Trade licences per 1,000 inhabitants | 106.3 | 102.8 |
| Municipal taxes and levies per inhabitant | 504 € | 564 € |
| Municipal debt per inhabitant | 1,043 € | 1,719 € |
Frequently asked questions
How many municipalities are there in Carinthia?
Carinthia has 132 municipalities. The most populous is Klagenfurt am Wörthersee, with 105,734 residents.
What is the population of Carinthia?
Carinthia has 569,990 residents (2026), or 60 people per km².
Which municipality in Carinthia is growing fastest?
Magdalensberg has the fastest growth in Carinthia over 10 years: +12.2%.
Other regions
Coat of arms: Unknown authorUnknown author, Public domain, Wikimedia Commons · Flag: Public domain, Wikimedia Commons. Coats of arms and flags are shown for identification only; this site is not affiliated with any public authority.

